

Dashboard#
The Dashboard provides an at-a-glance summary of your current resource usage, available limits, and session information across all your projects and resource groups. It helps you quickly understand how your computing resources are being utilized and monitor your recent activities in the system.
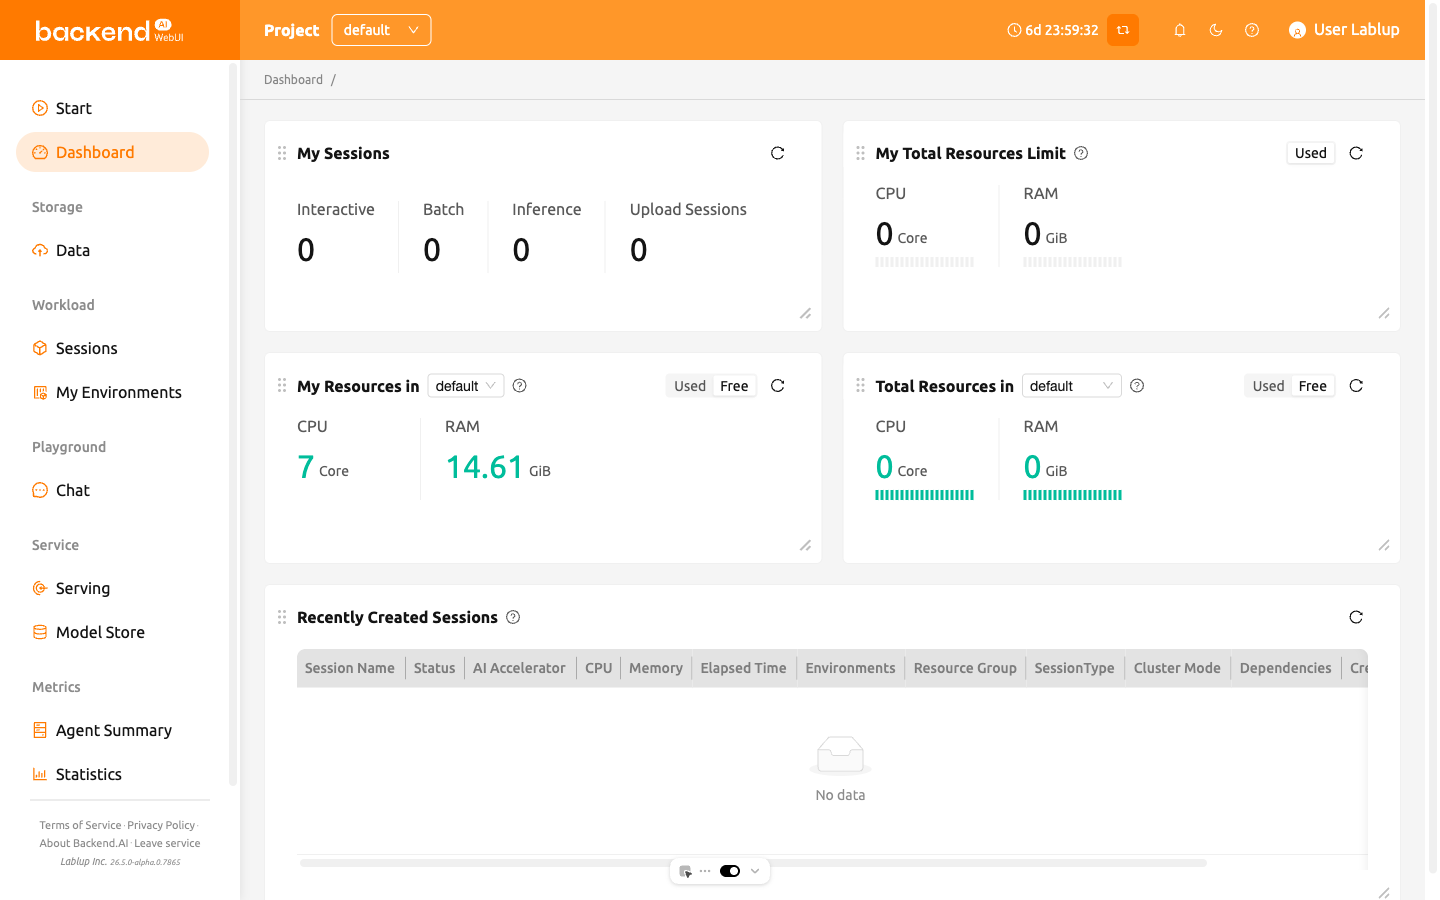
The page is composed of several main panels:
My Sessions: Shows the number of active sessions by type, such as Interactive, Batch, Inference, and Upload. You can quickly see how many sessions of each type are currently running.
My Total Resource Usage: Displays the resources you are currently using across all your projects. Each resource shows a usage bar below its value; hover over the bar to see how much of your total limit that usage represents. When multiple limits (domain, project, or keypair) apply, the most restrictive one takes effect.
My Resources in Resource Group: Shows your current resource usage and remaining capacity within the selected resource group of your current project. You can switch groups using the dropdown menu.
Folder Status: Shows how many storage folders you can reach, split into My Folders, Project Folders, and Invited Folders. When invitations are waiting for you, click the Invited Folders count to open the Data page and review them.
Quota per storage volume: Shows the quota available on each storage volume. When no storage host supports quota, the panel shows a notice instead.
Total Resources in Resource Group: Summarizes the overall used and free resources in the selected resource group. The data is aggregated from all agents that belong to the group.
The Total Resources in Resource Group panel may not be visible depending on your system configuration.
- Recently Created Sessions: Lists the most recently created active sessions within the current project. Provides session details such as name, status, CPU/memory usage, environment, resource group, session type, and creation time. By default, the latest 5 active sessions are displayed.
When you are logged in as a superadmin, the Dashboard page also displays Agent Statistics and Active Agents panels alongside the standard user panels. These panels show cluster-wide agent health and resource utilization. The My Sessions panel is titled Active Sessions for superadmins; it still counts the sessions of the current project.
Customizing the Dashboard Layout#
You can rearrange the board at any time — there is no mode to enter first:
- Move panels: Drag a panel by its header to reposition it on the board.
- Resize panels: Drag the bottom-right corner of a panel to adjust its size. Each panel has a minimum size to ensure its content remains readable.
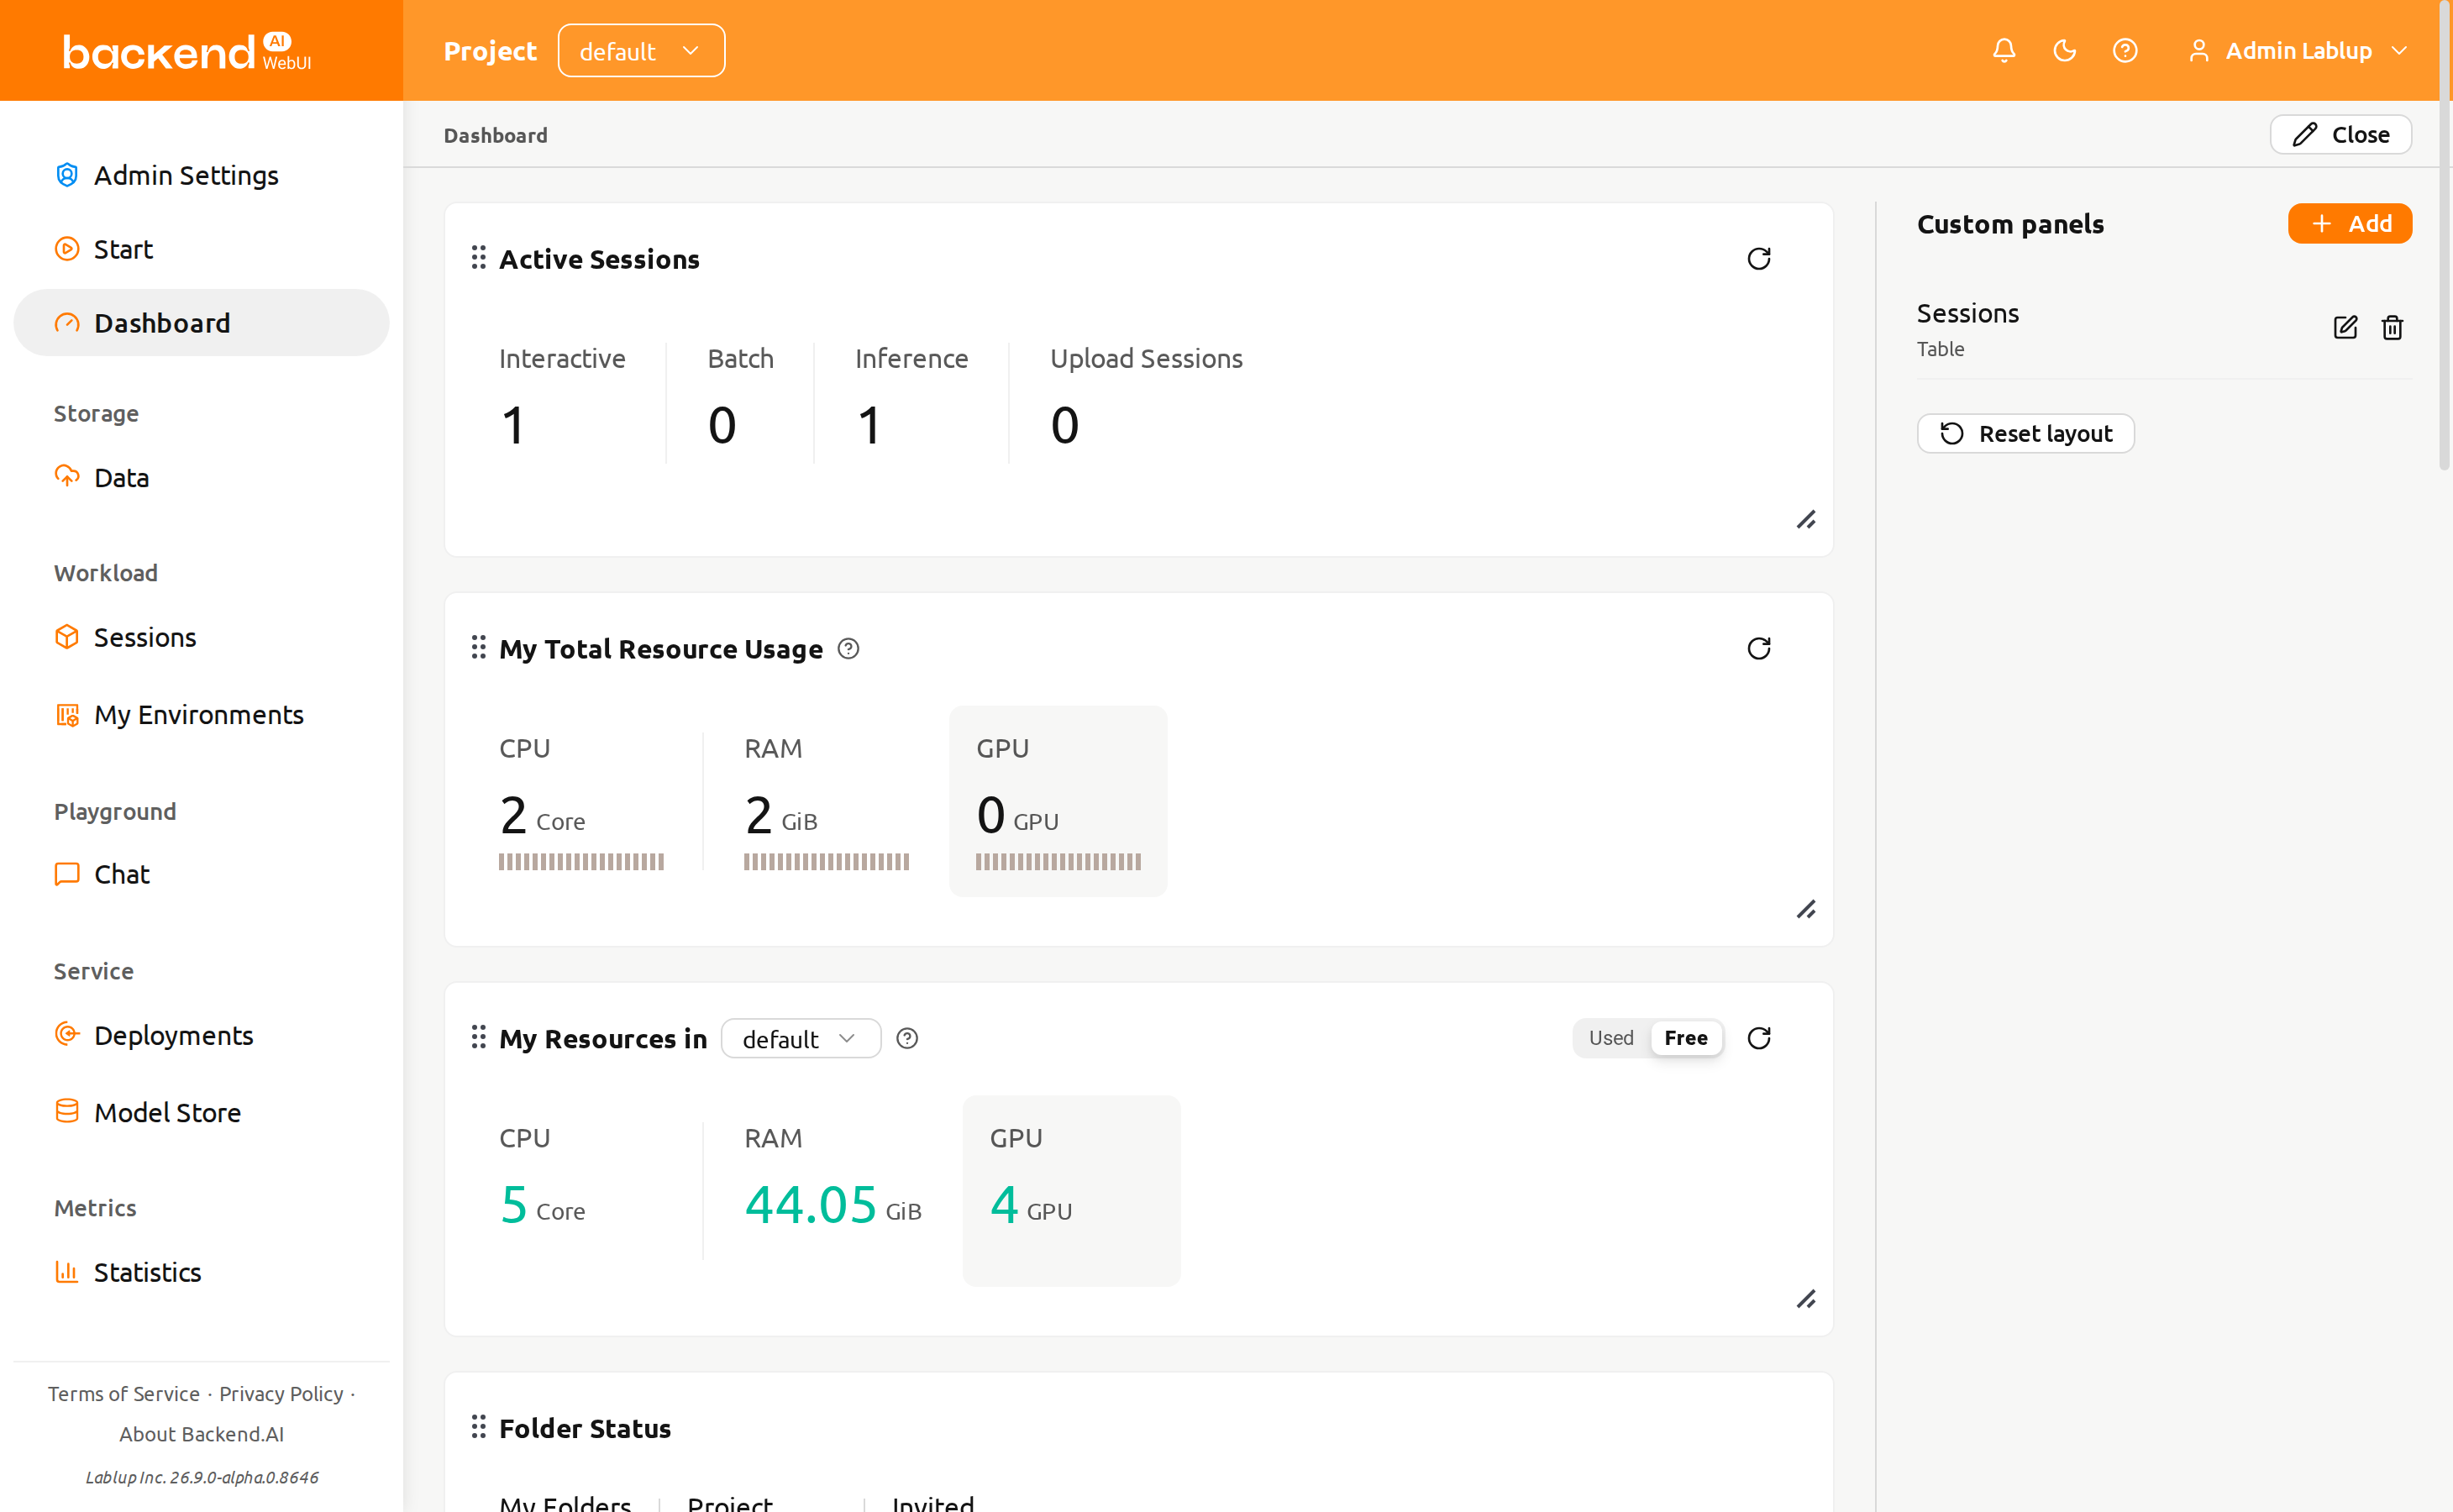
Your customized layout is automatically saved and persists across browser sessions. The layout is stored per user, so each user can have their own preferred arrangement. To discard your arrangement and restore the default one, click the Reset layout button at the bottom of the edit sidebar and confirm. Resetting the layout does not remove your custom panels.
When the WebUI is updated with new dashboard panels, those panels will automatically appear on your dashboard even if you have a saved custom layout.
Custom Panels#
The entire custom-panel feature is hidden until you turn on Custom dashboard panels in the Experimental features section of the User Settings page. If you turn the feature off later, your existing custom panels are hidden — not deleted — and reappear with their saved board positions once you turn it back on.
Click the Edit button at the top right of the page to open the custom-panel sidebar, and Close to hide it again. The sidebar lists your custom panels. A custom panel shows a data source you select, narrowed by a condition you define. The panel itself shows only a title and its data, so give the panel a title that describes its condition.
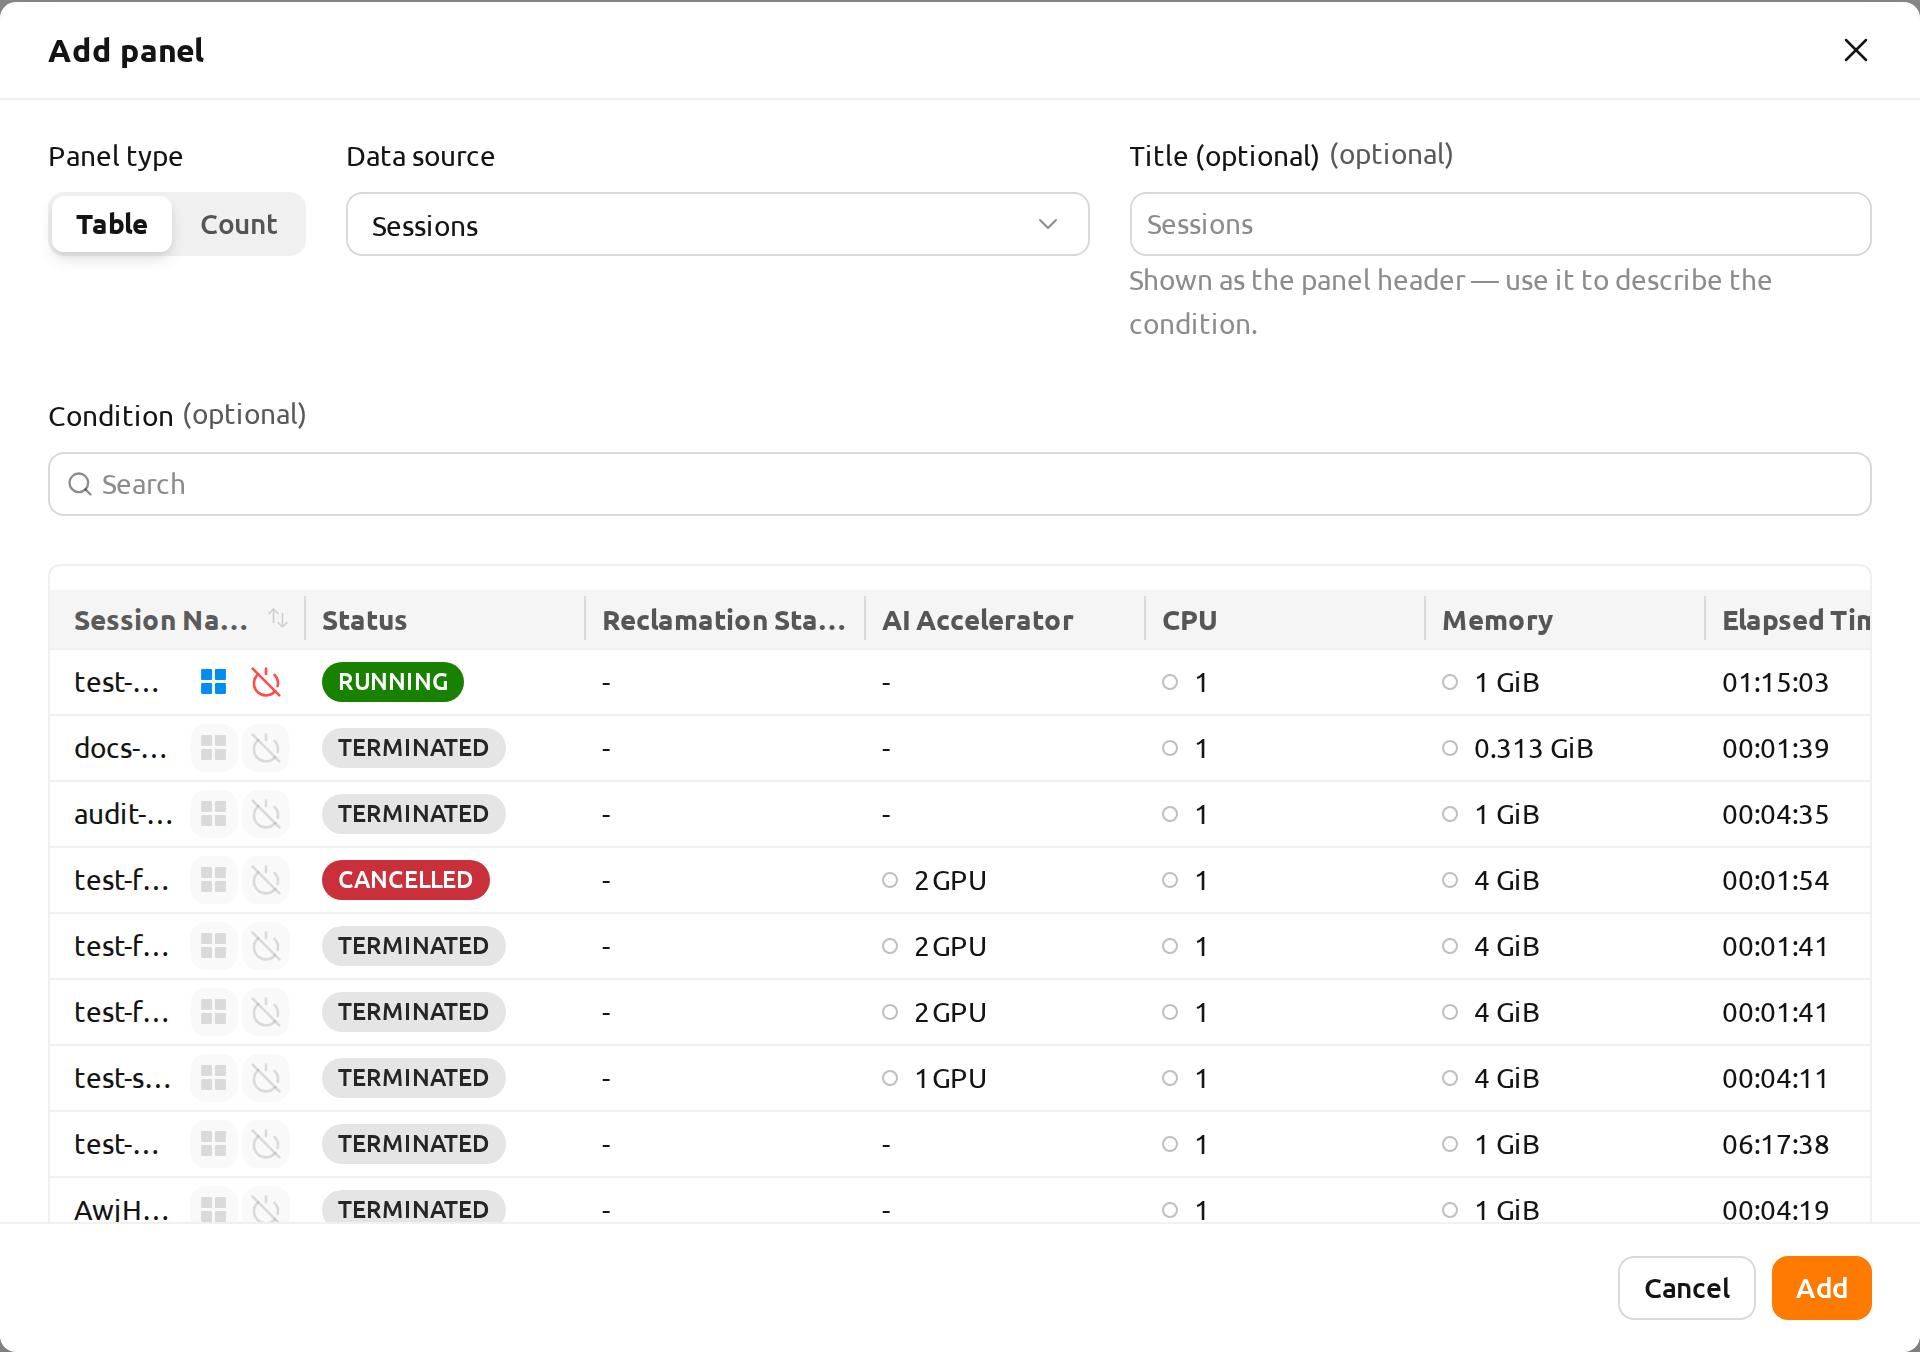
To add a panel, click the Add button in the sidebar. The panel dialog contains the following fields. Panel type and Data source are required — the dialog will not submit until both are chosen.
- Data source: The data source the panel lists. Choose Sessions, Deployments, or Data & Storage.
- Panel type: How the panel displays the data source. Choose Table or Count. For the Sessions data source, Grid is also offered.
- Title: An optional panel title. When omitted, the data source name is used.
- Condition: A property filter that narrows the rows shown in the panel.
A live preview below the fields shows the rows matching the current condition. Sorting a column in the preview sets the panel's sort order. Click Add to place the panel on the board.
Deployments panels list the project's model deployments, using the same table as the Deployments page: name, status, replica summary, model, and created at. Clicking a deployment's name opens its detail page. The condition filter offers name, tags, endpoint URL, and public (open to public).
Grid shows the session resource grid: each matching session's allocated resources as unit cells, colored by utilization. Clicking a session opens its detail drawer, the same as clicking a row in the table. The grid shows at most the first 100 matching sessions; a notice appears when there are more.
The grid's display settings — resource or kernel mode, which resource or metric to show, memory unit, and layout — are chosen in the Add/Edit panel dialog's live preview and saved with the panel. The panel itself shows no controls for these settings, so create a second panel if you want a different view.
Grid is an experimental feature. It is offered in the Panel type selector only when Session resource grid view is turned on under Experimental features. If it is turned off later, existing Grid panels keep their saved configuration but display as the session table until the setting is turned back on.
To change a panel's data source, panel type, condition, or title later, click the pencil (Edit) icon next to the panel in the sidebar — or in the panel's header on the board — and save your changes. To remove a panel, click the trash (Delete) icon and confirm in the popup.
Sessions and Deployments panels list data for the current project and are available to every project member. Data & Storage panels are available to superadmins only. A panel whose data source your role cannot query remains listed in the sidebar but is not shown on the board.
Automatic Refresh#
The dashboard refreshes its data automatically every 15 seconds, so the panels always reflect recent activity without reloading the page. Custom panels refresh on the same cycle as the built-in panels.